
A Practical Guide Using Annual Reports, Quarterly Results, and Disclosures
Introduction: Why a Step-by-Step Approach Matters
Many investors fail not because they lack intelligence, but because they analyze companies in a random and rushed way. They jump straight to ratios, price charts, or opinions without first understanding the business.
A step-by-step approach brings order, clarity, and discipline to company analysis. It ensures that you understand what the company does, how it performs, and what risks you are taking before investing your money.
Step 1: Understand the Business (Before Any Numbers)
The first step in analyzing any company is to clearly understand what business it is actually in. If this is unclear, no amount of financial analysis will help.
Ask yourself:
- What product or service does the company sell?
- Who are its customers?
- How does it make money?
- Why do customers choose it over competitors?
At this stage, avoid numbers. Focus only on business logic and simplicity.
Step 2: Study the Industry and Competitive Position
A good company in a bad industry often struggles, while an average company in a strong industry can do well. Industry context is critical.
Understand:
- Industry growth rate
- Level of competition
- Entry barriers
- Pricing power
- Regulatory influence
This helps you judge whether the company’s growth is sustainable or temporary.
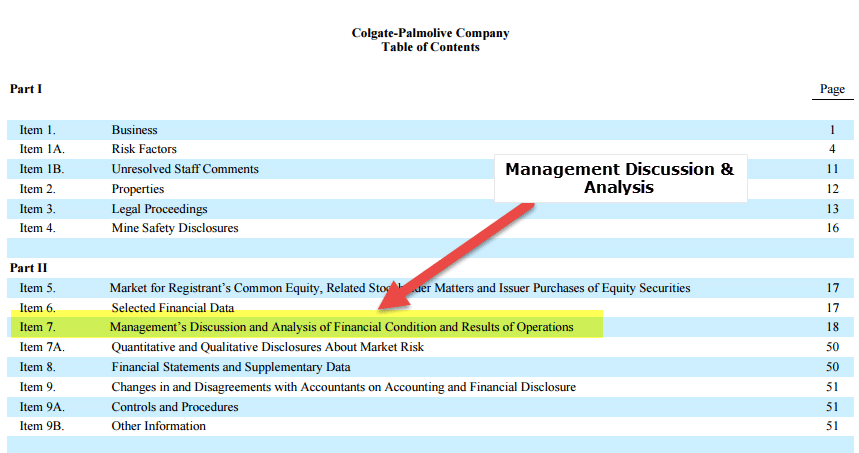
Step 3: Read the Annual Report (The Backbone of Company Analysis)
The annual report is the most important document published by a listed company. It reflects management’s own view of the business, risks, and future direction.
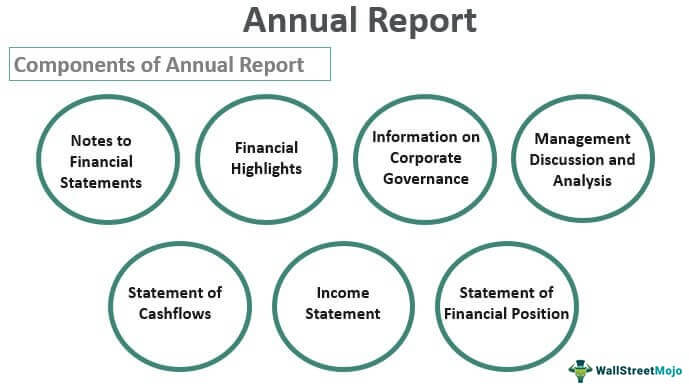


Key Sections to Focus On in an Annual Report
1. Business Overview & Management Discussion
This section explains how the business works, what changed during the year, and management’s outlook. Read this carefully to understand the company’s strategy and priorities.
2. Financial Statements
These include the income statement, balance sheet, and cash flow statement. Together, they show profitability, financial stability, and cash generation ability.
3. Notes to Accounts
This is where many risks and realities are hidden. Accounting policies, contingent liabilities, and exceptional items are disclosed here.
4. Corporate Governance & Risk Section
This section helps assess management quality, board independence, and transparency. Poor governance is often a red flag for long-term investors.
Step 4: Analyze Financial Statements (Story Behind the Numbers)
Income Statement Analysis
The income statement shows whether the company is growing profitably.
Focus on:
- Revenue growth consistency
- Operating margins
- Net profit trends
- One-time or exceptional items
Stable and improving margins usually indicate a strong business model.
Balance Sheet Analysis
The balance sheet shows financial strength and risk.
Look at:
- Debt levels and trends
- Cash reserves
- Asset quality
- Equity dilution
A strong balance sheet provides resilience during downturns.
Cash Flow Statement Analysis
Cash flow tells you whether profits are real.
Analyze:
- Operating cash flow vs net profit
- Capital expenditure needs
- Free cash flow generation
Companies that consistently generate cash have greater flexibility and survival power.
Step 5: Analyze Quarterly Results (Tracking Business Health)
Quarterly results show how the business is performing right now. They help validate whether the long-term story is intact.
Focus on:
- Revenue and profit trends over multiple quarters
- Margin stability
- Management commentary
- Sudden deviations or surprises
Avoid reacting to a single quarter. Always compare at least 6–8 quarters.
Step 6: Compare Year-on-Year and Quarter-on-Quarter Data
Raw numbers are meaningless without comparison.
Use:
- Year-on-Year (YoY) comparison to assess growth quality
- Quarter-on-Quarter (QoQ) comparison to spot short-term trends
Consistent growth is more important than sharp but unstable spikes.
Step 7: Review Other Important Company Disclosures
Listed companies publish several other reports that investors often ignore.
Important Reports to Track
- Investor presentations
- Earnings call transcripts
- Credit rating reports
- Shareholding pattern disclosures
- Related party transactions
- Regulatory filings and announcements
These reports often reveal early signals of change—good or bad.
Step 8: Assess Management Quality and Capital Allocation
Management quality determines how well profits are used.
Evaluate:
- Consistency between words and actions
- Capital allocation decisions
- Dividend and reinvestment strategy
- History of acquisitions or expansions
Even a strong business can be destroyed by poor capital allocation.
Step 9: Identify Key Risks (Before Valuation)
Every company carries risks. The goal is not to eliminate risk, but to understand it clearly.
Common risks include:
- Industry disruption
- High debt
- Regulatory changes
- Customer concentration
- Management credibility
Write risks down. If you cannot explain them, you don’t understand them.
Step 10: Valuation (Only After Business Understanding)
Valuation comes last, not first.
At this stage:
- Compare valuation with peers
- Assess growth expectations priced in
- Decide margin of safety
Never force a valuation to justify liking a company.
Step 11: Form Your Investment Thesis
An investment thesis is a short written summary of your reasoning.
It should include:
- Why the business is attractive
- What could go wrong
- What needs to go right
- Time horizon
If you cannot write this clearly, do not invest.
Common Mistakes While Analyzing Companies
Many investors:
- Read only summaries, not reports
- Ignore cash flows
- Overreact to quarterly noise
- Trust management blindly
- Skip risk assessment
A disciplined process protects you from most of these mistakes.
Final Thoughts: Process Beats Intelligence
Company analysis is not about being the smartest person in the room. It is about following a repeatable, structured process consistently.
If you analyze companies step by step, your decisions improve naturally over time. Markets reward patience, clarity, and discipline far more than speed.
At EquiDeck, every future company deep-dive will follow this exact framework.
For example i will use TCS for reference:
Here’s the real-company deep-dive for Tata Consultancy Services Limited (TCS) using actual reported numbers from the company’s FY 2024–25 results (BSE/NSE disclosures + investor relations) — including annual revenue, profit, margins, and quarterly context — applying the EquiDeck step-by-step framework.
Company Analysis: Tata Consultancy Services (TCS)
A Step-by-Step Equity Research Framework with Numbers (FY 2024-25)
Step 1: Business Understanding (Before Numbers)
Tata Consultancy Services is a global IT services and consulting firm that helps enterprises build, maintain, and modernize mission-critical technology systems. It earns revenue primarily by delivering long-term technology solutions across sectors such as banking, finance, manufacturing, healthcare, telecom, and retail.
Because TCS delivers enterprise-wide transformation projects and recurring managed services, its revenues are more stable than purely transactional business models — a key strength for long-term investors.
Step 2: Industry & Competitive Position
TCS operates in the global IT services industry — a sector driven by digital transformation, cloud adoption, data initiatives, and automation. Its competitive advantages include:
- Scale and global footprint
- Strong brand association with the Tata Group
- Large client base with long contract durations
- Repeated renewal of multi-year deals
This stickiness in business models helps maintain revenue consistency even during slowdown phases.
Step 3: Annual Report & Financial Highlights
Although we couldn’t read the specific PDF directly, the FY 2024-25 annual results from TCS investor relations and corporate disclosures provide key figures: (Tata Consultancy Services)
FY 2024-25 Consolidated Financial Highlights
- Revenue: ₹2,55,324 crore (~+6.0% YoY) (Inves 21)
- Net Profit (Consolidated): ₹48,553 crore (~+5.8% YoY) (Inves 21)
- Operating Margin: ~24.3% (Tata Consultancy Services)
- Net Margin: ~19.0% (Tata Consultancy Services)
- Dividend: Info typically in the annual report (standalone + consolidated amounts are disclosed) (Inves 21)
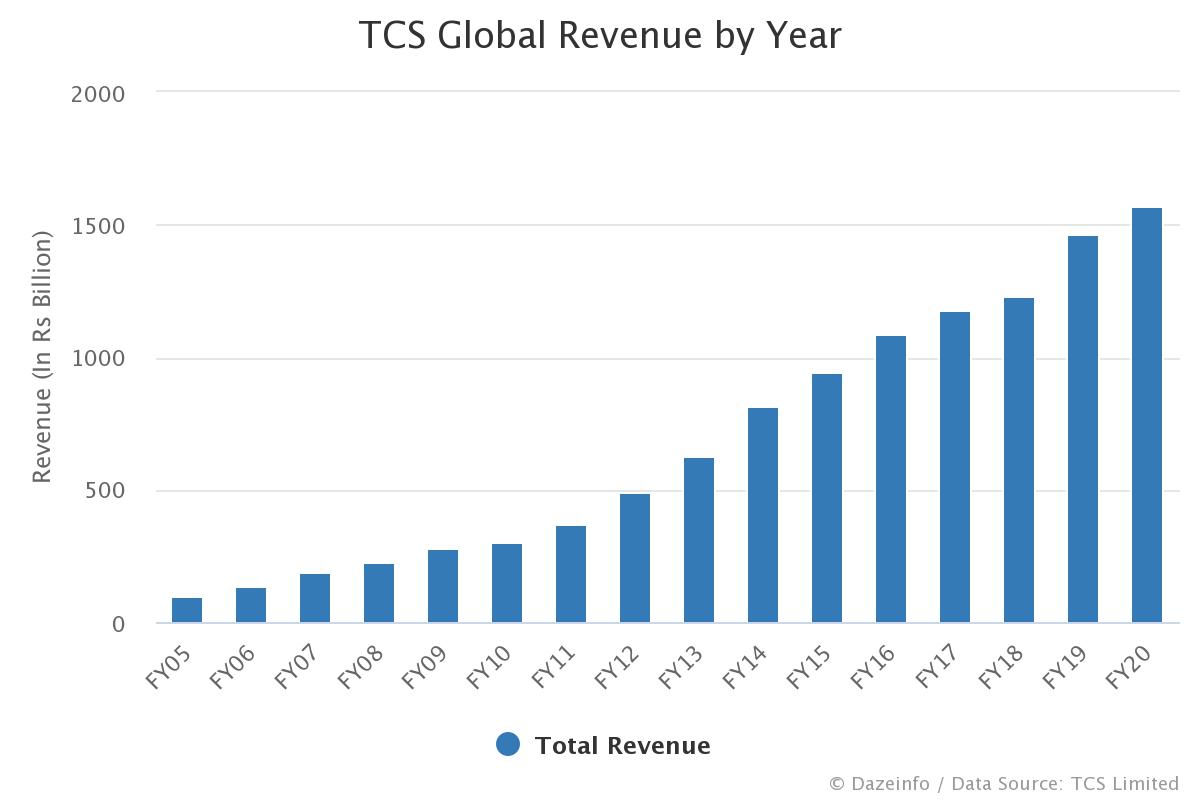
TCS crossed US$30 billion in annual revenue for FY 2024-25 — a significant milestone signaling both scale and global demand. (Tata Consultancy Services)
These numbers reflect consistent growth, not dramatic spikes — fitting its profile as a stable, mature IT leader.
Step 4: Financial Statement Analysis (Story Behind the Numbers)
Income Statement Insights
- Revenue growth of ~6% YoY indicates healthy demand for tech services. (Inves 21)
- The net profit increase of ~5.8% reflects operating efficiency despite global macro uncertainties. (Inves 21)
- Margins above ~19% show strong profitability compared with many peers. (Tata Consultancy Services)
Interpretation: TCS is not chasing explosive growth; it prioritizes predictable earnings and stable margins — a hallmark of less volatile businesses.
Balance Sheet Strength
Balance sheet data from interim filings shows:
- Strong equity base and significant assets. (Tata Consultancy Services)
- Large cash and investments balances typically reflected in annual statements. (Tata Consultancy Services)
TCS’s balance sheet is characterized by low or zero net debt in most periods, indicating financial flexibility and capital return capacity. (Inves 21)
Cash Flow Insights
Although specific cash flow numbers require the annual report itself, TCS historically converts profits into cash efficiently, enhancing shareholder value via dividends and buybacks.
Step 5: Quarterly Results (Short-Term Performance)
Quarterly updates for FY 2025 and the current year FY 2025-26 indicate:
- Q1 FY 2025-26 PAT ~₹12,760 crore (up ~6% YoY). (The Times of India)
- Quarterly revenue patterns show moderate growth amid headwinds. (The Economic Times)
Interpretation: Quarterly results add context to the annual performance — they help confirm whether the long-term trend remains intact or if short-term volatility is taking shape.
Step 6: Comparisons (YoY & QoQ)
📌 Year-on-Year (YoY)
- Revenue up ~6% YoY
- Profit up ~5.8% YoY
This type of consistent YoY comparison reveals steady demand and controlled cost structure, not boom-bust performance.
📌 Quarter-on-Quarter (QoQ)
- Short-term fluctuations (e.g., revenue dips from global slowdowns) provide early indicators of macro pressures. (The Economic Times)
Together, YoY and QoQ help differentiate structural trends from noise.
Step 7: Other Important Disclosures
For companies like TCS, investors should review:
- Investor presentations (strategy + order book) (Tata Consultancy Services)
- Shareholding patterns
- Earnings call transcripts
- Regulatory disclosures
- Segmental revenue breakdowns
These provide insights often before consolidated annual numbers appear.
Step 8: Management & Capital Allocation
TCS management emphasizes:
- Renewing large enterprise contracts
- Expanding digital and cloud portfolios
- Investing in AI-led services
For example, TCS reported annualized AI service revenue of ~$1.5 billion, highlighting growth in high-potential segments. (The Times of India)
Capital allocation historically includes dividends, steady buybacks, and conservative reinvestment.
Step 9: Key Risks (Before Valuation)
Common risk factors include:
- Global tech spending slowdowns
- Currency fluctuations
- Client budget tightening
- Competitive pressure from global IT firms
Quarterly variability can sometimes reflect these risks earlier than annual summaries.
Step 10: Valuation (After Understanding Business)
Valuation now depends on:
- Growth prospects vs peers
- Risk premium for global exposures
- Profit margin sustainability
Investors typically compare TCS valuation multiples (P/E, EV/EBITDA) relative to industry peers after confirming the business story is intact.
Step 11: Investment Thesis (Hypothetical Example)
Why it could be attractive:
Steady revenue and profit growth, strong margins, global footprint, extensive client base.
What could go wrong:
Demand contraction in key markets, pricing pressure, or slower adoption of enterprise tech spending.
Time horizon:
Long-term, capital preservation with predictable earnings.
What’s Next on EquiDeck?
Next articles will cover:
- How to read financial statements simply
- How to spot red flags in annual reports
- Real company case studies using this framework
Master this process, and investing becomes far less intimidating.


0 Comments